Consulting the progress of the students (learningCloud)
If you have the role of tutor of the course, you will be able to consult the progress of the students in the course and in each of its sessions.
Consulting the progress of students in a session
- Go to the details of the session.
- Select the Students tab.
- Click on Generate report to extract information on the progress of students in the session in an Excel format.
- If you click on the name of a student, you will access his or her card and you will see more information about that student.
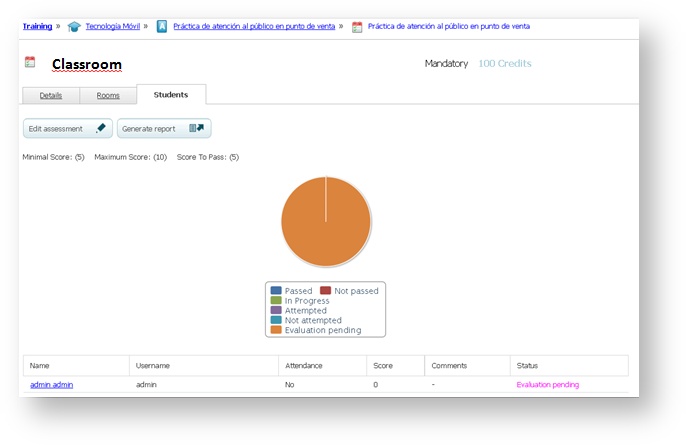
You will see an interactive graph above the list of students which represents the status of students in the session. For example, you can click on Not attempted and see the percentage of students that has not started the activity yet.
You will see the list of students below the graph and following information for each one:
- Total time: it is the total time that the student spent on the session. It will only reflect the time of those SCORM/AICC/Tin Can activities which are configured to collect this information.
- Attendance: it indicates if the student has attended or not the session (in the case of Classroom or Web conference sessions). For the rest of the activities it indicates if the student has accessed or not the content (File, Exercise, SCORM/AICC/Tin Can, Link or Video sessions).
- First access date and last access date: the date of the first and last access of the student to the session.
All sessions will have the previous data, and in some cases there will be the following data as well:
- Score: in the case of assessable sessions. Whether they are assessed by a trainer (Classroom, Exercise and Web conference), or they have automatic assessment (SCORM Assessment and SCORM/AICC/Tin Can activity).
- Times accessed: times that the student has accessed the SCORM/AICC/Tin Can content (only if the content is configured to collect this information).
Consulting the progress of students in a course
You will only see the information about the progress of students in courses in which you are a tutor.
- Go to the details of a course.
- Select the Students tab.
- Click on Display results of the course to extract information about the progress of the students in an Excel format.
- You can also generate a report of a specific student by clicking on Generate report on the right of the student you want to consult.
- If you click on the name of the student you will access his or her card and you will see more information about that student.
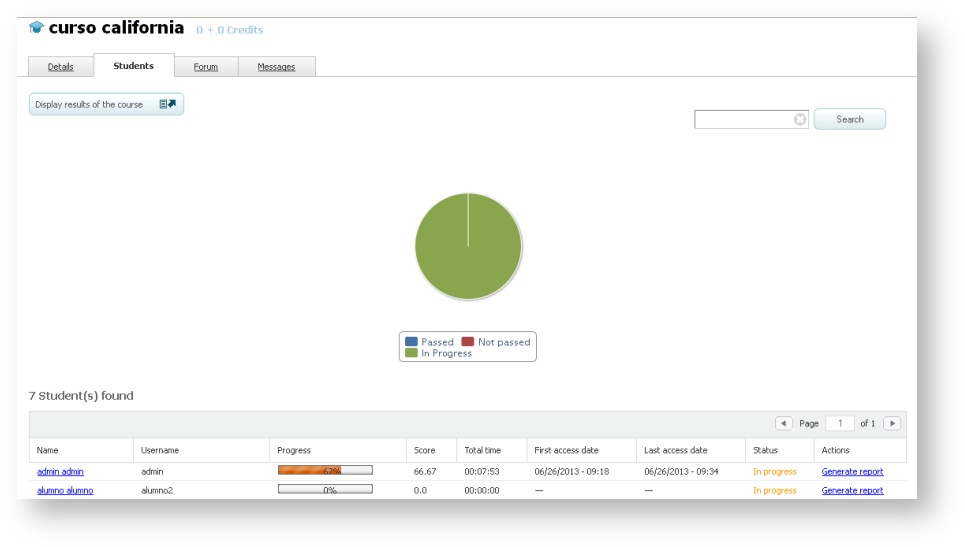
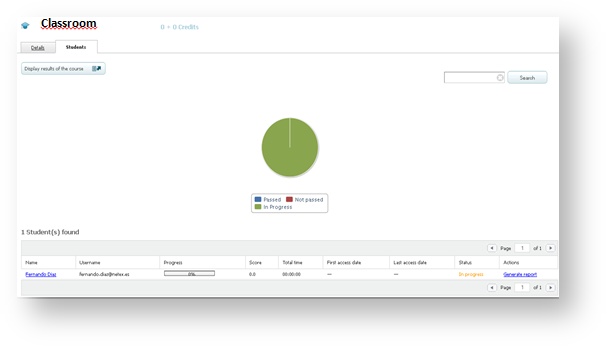
You will see an interactive graph above the list of students which represents the percentage of student in each of the possible statuses of the course. For example, you can click on "Not passed" and see the percentage of students that has not passed the course yet.
You will see the list of students below the graph and the following information for each one of them:
- Total time: it is the total time that the student spent on the SCORM/AICC/Tin Can sessions of the course. This data will only be reflected in case that the content is configured to collect this information.
- Attendance: it indicates if the student has attended or not the session (in the case of Classroom or Web conference sessions). For the rest of the activities, it indicates if the student has accessed or not the content (File, Exercise, SCORM/AICC/Tin Can, Link or Video sessions).
- Number of attempts: this field will only appear for those SCORM/AICC/Tin Can sessions which allow several attempts.
- First access date and last access date: the date of the first and last access of the student to any of the sessions which are part of the course.
Consulting the progress of students in a plan
You will only see the information about the progress of students in courses of a plan if you are a tutor.
- Go to the course of a plan where you are a tutor.
- Select the Students tab.
- Click on Display results of the course.
You will see an interactive graph above the list of students which represents the percentage of student in each of the possible statuses of the course. For example, you can click on "Not passed" and see the percentage of students that has not passed the course yet.
You will see the list of students below the graph and the following information for each one of them:
- Progress bar: this bar shows the percentage of courses passed in this plan, whether they are mandatory or not.
- Score: this column shows the average score that the student got on the plan. This average is calculated on the basis of the scores obtained by the student in each course of the plan. As for the score of a course, it is calculated from the score obtained in the assessable sessions.
- Total time: it is the total time that the student spent on SCORM/AICC/Tin Can activities which are part of the courses of the plan (provided that these sessions are configured to collect this information).
- First access date and end access date: the date of the first and last access of the student to any of the sessions which are part of the course.